How to Use This Assessment
This self-assessment framework is designed to help you evaluate your organisation’s MarTech maturity across the 5 components introduced in The Concept of MarTech Maturity:
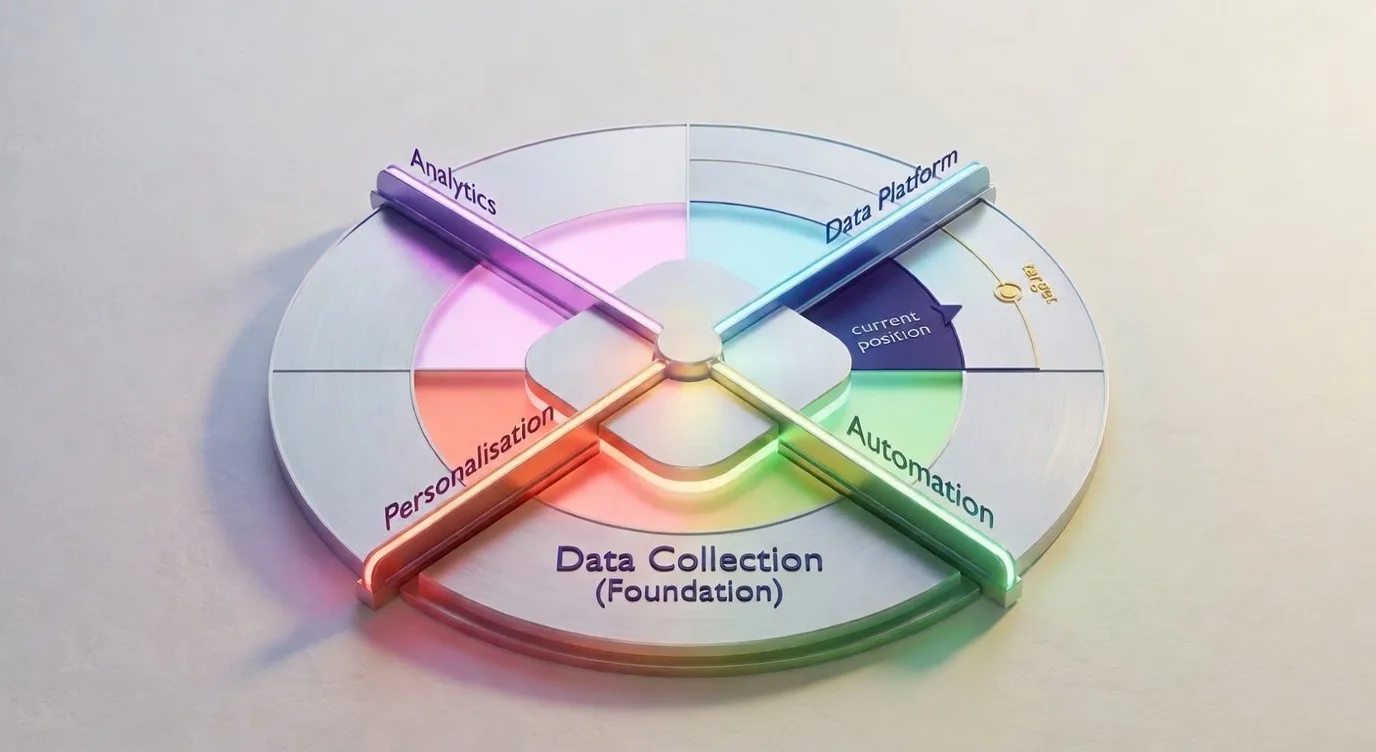
The Foundation: Data Collection (The Bedrock of Integrity) — Everything builds on this
The Four Pillars: Analytics & Reporting, Data Platform, Marketing Automation, Testing & Personalisation
Instructions:
- Read the descriptors for each level within all 5 components
- For each, identify which level best describes your current state (be honest, not aspirational)
- Mark your current level on the scoring sheet at the end of this chapter
- Identify your target level for the next 12-18 months
- Calculate your maturity gap: Target − Current = Priority Focus Areas
Time required: 30-45 minutes for an individual assessment; 2-3 hours for a team workshop.
Who should participate: Include representatives from Marketing, IT/Digital, Analytics, and Marketing Operations. Different perspectives will reveal gaps and alignment opportunities.
Assessment: The 5 Components
The Foundation: Data Collection (The Bedrock of Integrity)
The bedrock of MarTech maturity. Without high-integrity data, all downstream capabilities are compromised. This is not “Pillar 1 of 5” — it is the ground everything else stands on.
Level 1: Ad-Hoc & Fragmented
- Tracking is implemented inconsistently across properties
- No centralised Solution Design Reference (SDR) or data layer documentation
- QA is manual, reactive, and infrequent
- Privacy compliance is handled market-by-market (if at all)
- Data quality issues are discovered only when reports look wrong
Level 2: Standardised
- SDR exists and is documented, but adoption varies by market
- Data layer implemented on key properties, but gaps remain
- QA process exists, but relies on manual checks before major campaigns
- Privacy compliance (GDPR, CCPA) is implemented but inconsistently enforced
- Some visibility into data quality, but issues still slip through
Level 3: Governed & Automated
- Centralised SDR enforced across all markets and properties
- Comprehensive data layer covering all digital touchpoints
- Automated QA with 24/7 monitoring and alerting
- Privacy compliance baked into data collection architecture
- Proactive data quality management with clear ownership (CoE or Marketing Operations)
Level 4: Strategic Asset
- Data collection treated as a strategic capability, not a technical afterthought
- Real-time data quality dashboards with predictive issue detection
- Privacy-compliant by design and consent management integrated seamlessly
- Data collection infrastructure enables advanced use cases (identity resolution, real-time personalisation)
- Continuous optimisation based on data integrity metrics and business impact
Your Current Level: [ ] 1 [ ] 2 [ ] 3 [ ] 4
Your Target Level (12-18 months): [ ] 1 [ ] 2 [ ] 3 [ ] 4
Key Gaps to Address:
Pillar 1: Analytics & Reporting (Insight & Visibility)
Transforming raw data into actionable insights that drive decision-making at all levels.
Level 1: Manual & Retrospective
- Reports are manual PDFs exported and distributed monthly
- Data is outdated by the time stakeholders receive it
- No self-service analytics, where all requests go through a central analyst
- Metrics are vanity-focused (page views, visits) rather than business outcomes
- No attribution modelling, with last-click dominates
Level 2: Reactive & Basic
- Some dashboards exist (Google Data Studio, Tableau), but limited adoption
- Data latency: T+1 day or weekly refresh cycles
- Self-service is available for basic reports, but advanced analysis requires support
- Mix of vanity and business metrics, with inconsistent definitions across teams
- Basic attribution (last-click, first-click) is available but rarely used
Level 3: Self-Service & Real-Time
- Comprehensive self-service dashboards with high adoption across marketing teams
- Real-time or near-real-time data (sub-hour latency)
- Standardised metrics and definitions documented and enforced
- Business outcome metrics (conversion rate, revenue, APE) integrated into analytics
- Multi-touch attribution models are available and actively used for optimisation
Level 4: Predictive & Prescriptive
- Analytics predicts future outcomes (propensity models, churn risk, LTV forecasting)
- Prescriptive recommendations generated automatically (e.g., “reallocate budget to X”)
- Analytics embedded directly into workflow tools (campaign platforms, media buyers)
- Advanced attribution connected to downstream business value (revenue, APE, retention)
- “Single Source of Truth” is widely trusted and used for executive decision-making
Your Current Level: [ ] 1 [ ] 2 [ ] 3 [ ] 4
Your Target Level (12-18 months): [ ] 1 [ ] 2 [ ] 3 [ ] 4
Key Gaps to Address:
Pillar 2: Data Platform (Infrastructure & Unification)
The connective tissue that enables data to flow seamlessly across the MarTech stack.
Level 1: Data Islands
- Each team/channel has its own separate data source
- Web analytics, CRM, email, and media platforms don’t integrate
- No consistent customer identifier across systems
- Manual data exports and Excel-based consolidation are common
- Conflicting numbers across teams and no agreement on “the truth”
Level 2: Partially Integrated
- Some point-to-point integrations exist (e.g., web → email platform)
- CRM and web analytics are partially connected, but gaps remain
- Customer identification is possible in some channels, not others
- The data warehouse exists but is underutilised for marketing use cases
- Teams still spend significant time reconciling data discrepancies
Level 3: Unified Platform (CDP/Data Lake)
- Customer Data Platform (CDP) or unified data lake implemented
- Identity resolution working across digital channels (web, mobile, email)
- “Golden record” of the customer exists and is actively used
- Real-time data flows enable triggered campaigns and personalisation
- A data governance framework ensures quality and consistency
Level 4: Real-Time Ecosystem
- Fully real-time data pipeline from collection to activation
- Identity resolution includes offline touchpoints (call centre, in-branch, events)
- Predictive scores (propensity, churn, LTV) are computed and activated in real-time
- Data platform enables advanced use cases: lookalike modelling, next-best-action, dynamic segmentation
- Platform treated as a shared enterprise asset with clear ownership (CoE or Data team)
Your Current Level: [ ] 1 [ ] 2 [ ] 3 [ ] 4
Your Target Level (12-18 months): [ ] 1 [ ] 2 [ ] 3 [ ] 4
Key Gaps to Address:
Pillar 3: Marketing Automation (Efficiency & Orchestration)
Orchestrating customer engagement at scale through triggered, multi-step journeys.
Level 1: Manual & Batch-and-Blast
- Campaigns are manually executed (one-off emails, ad-hoc pushes)
- “Batch and blast” messaging: same content to all recipients
- No triggered or event-based campaigns
- Cross-channel coordination is manual and inconsistent
- Performance measured by opens/clicks, not downstream impact
Level 2: Basic Triggered Campaigns
- Some triggered campaigns exist (welcome series, cart abandonment)
- Campaigns are single-channel (email only, or push only)
- Limited personalisation beyond the first name
- The campaign build process is slow and manual
- Performance tracking is siloed by channel
Level 3: Multi-Step Orchestration
- Complex, multi-step customer journeys running 24/7
- Cross-channel orchestration (email + push + web + paid media)
- Dynamic content based on customer segment or behaviour
- Journey analytics: drop-off points, conversion rates, time-to-convert tracked
- The CoE or Marketing Operations team maintains the campaign library and best practices
Level 4: AI-Driven & Predictive
- AI/ML determines next-best-action for each customer in real-time
- Journeys dynamically adapt based on predicted intent and propensity
- Automated optimisation: underperforming paths auto-paused, winning variants auto-scaled
- Closed-loop measurement: automation impact connected to revenue/LTV
- Scalable playbook: new markets onboarded quickly with reusable journey templates
Your Current Level: [ ] 1 [ ] 2 [ ] 3 [ ] 4
Your Target Level (12-18 months): [ ] 1 [ ] 2 [ ] 3 [ ] 4
Key Gaps to Address:
Pillar 4: Testing & Personalization (Optimization & Experience)
Continuously improving customer experience through evidence-based experimentation and adaptive content.
Level 1: No Testing or Basic Personalisation
- No structured A/B testing program
- Personalisation limited to first name in email subject lines
- Decisions based on opinions, not data
- No dedicated testing tools or platform
- Website/app experience is one-size-fits-all
Level 2: Ad-Hoc Testing
- A/B testing happens, but irregularly and without statistical rigour
- Test ideas come from HiPPOs (Highest Paid Person’s Opinion)
- Personalisation rules are manual and static (if-then logic based on a segment)
- A testing tool exists, but is underutilised
- Results are not systematically documented or shared
Level 3: Systematic Optimisation
- Structured testing roadmap with prioritised backlog
- Statistical significance calculated, tests run to completion
- Personalisation engine deployed with dynamic content rules
- Test results documented in shared repository, learnings inform future tests
- Dedicated resources (FTE or agency) managing the testing program
Level 4: AI-Driven Personalisation at Scale
- Real-time personalisation: content adapts based on current session behaviour + historical data
- AI/ML models power recommendations, offers, and content prioritisation
- Automated experimentation: AI suggests and runs tests autonomously
- Personalisation impact is measured and connected to business outcomes
- “Test and learn” culture embedded across marketing teams
Your Current Level: [ ] 1 [ ] 2 [ ] 3 [ ] 4
Your Target Level (12-18 months): [ ] 1 [ ] 2 [ ] 3 [ ] 4
Key Gaps to Address:
Scoring Sheet
Step 1: Record Your Scores
| Component | Current Level | Target Level | Gap (Target − Current) |
| Foundation: Data Collection | |||
| Pillar 1: Analytics & Reporting | |||
| Pillar 2: Data Platform | |||
| Pillar 3: Marketing Automation | |||
| Pillar 4: Testing & Personalization | |||
| Total |
Step 2: Calculate Your Maturity Score
Overall Maturity Score = (Sum of all 5 component levels) ÷ 5
Example: Foundation(2) + Analytics(2) + Platform(3) + Automation(2) + Personalization(1) = 10 ÷ 5 = 2.0 (Level 2 overall maturity)
Your Overall Maturity Score: ___
Foundation Health Check: If the Foundation (Data Collection) score is below Level 2, prioritise fixing it before investing heavily in the pillars. A weak foundation compromises everything built on top.
Step 3: Identify Priority Focus Areas
High Priority (Gap ≥ 2): Requires immediate attention. Large gaps indicate significant risk or missed opportunity.
Medium Priority (Gap = 1): Should be on your roadmap for the next 12-18 months.
Low Priority (Gap = 0): Already at target level. Maintain and optimise.
Foundation Rule: If the Foundation gap ≥ 1, make it your #1 priority regardless of other gaps.
Interpreting Your Results
If Your Overall Score is 1.0-1.9: Foundations Level
What it means: Your MarTech stack is in early stages. Basic capabilities may exist, but they’re fragmented and underutilised.
Recommended next steps:
- Focus on the Foundation (Data Collection) first. Without high-integrity data, investments in the pillars will underperform.
- Build foundational documentation: SDR, data layer spec, metric definitions.
- Establish basic governance: Who owns what? Who approves changes?
- Pick one quick win: A simple dashboard, a triggered welcome campaign, or a basic A/B test to build momentum.
Expected timeline to Level 2: 6-12 months (depending on resources and organisational buy-in).
If Your Overall Score is 2.0-2.9: Standardised Level
What it means: You have foundational capabilities in place, but they’re not fully leveraged. You’re ready to scale.
Recommended next steps:
- Ensure the Foundation is at Level 3 before major investments.
- Invest in unification and automation (Pillars 2 & 3).
- Stand up a CoE or Marketing Operations function to govern standards and enable self-service.
- Roll out self-service analytics to reduce bottlenecks and empower teams.
- Launch a structured testing program to build a culture of optimisation.
Expected timeline to Level 3: 12-18 months.
If Your Overall Score is 3.0-3.9: Governed & Optimised Level
What it means: You’re ahead of most enterprises. You have solid governance, automation, and analytics. Now it’s about unlocking advanced capabilities.
Recommended next steps:
- Invest in AI/ML capabilities for predictive analytics and personalisation.
- Expand identity resolution to include offline channels and third-party data.
- Build advanced attribution models connected to business outcomes.
- Scale reusable assets: Journey templates, modular campaigns, shared dashboards.
Expected timeline to Level 4: 18-24 months.
If Your Overall Score is 4.0: Strategic Asset Level
What it means: Congratulations! You’re in the top tier of MarTech maturity. Your stack is a competitive advantage.
Recommended next steps:
- Continue innovating: Experiment with emerging tech (generative AI, privacy-safe identity solutions).
- Share your playbook: Document and socialise your approach internally and (if appropriate) externally.
- Focus on continuous optimisation: Even at Level 4, there’s always room to improve.
- Mentor other teams: Help less mature parts of the organisation level up.
Common Assessment Pitfalls (And How to Avoid Them)
Pitfall 1: Aspirational Scoring
Mistake: Rating yourself at the level you want to be, not where you actually are.
Fix: Be brutally honest. If you have to say, “Well, we sort of do this,” you’re probably not at that level yet. Better to underestimate and over-deliver.
Pitfall 2: Single-Person Assessment
Mistake: One person completes the assessment without input from other teams.
Fix: Run this as a workshop with Marketing, IT, Analytics, and Marketing Operations. Different perspectives will reveal blind spots and alignment gaps.
Pitfall 3: Ignoring the Foundation
Mistake: Prioritising advanced capabilities (e.g., Personalisation) before solidifying the Foundation (Data Collection).
Fix: Use the Foundation Rule. If Data Collection is below Level 2, nothing else matters until you fix it. A crack in the foundation compromises everything above it.
Pitfall 4: Analysis Paralysis
Mistake: Trying to fix all components at once.
Fix: Pick 1-2 priority areas for the next 12 months. Create a focused roadmap. Get wins on the board before expanding scope.
Pitfall 5: No Follow-Through
Mistake: Completing the assessment, then filing it away without action.
Fix: Schedule a follow-up workshop in 90 days to review progress. Treat this as the starting point of a transformation, not a one-time exercise.
From Assessment to Roadmap
Once you’ve completed this assessment, you’re ready to build your transformation roadmap. Here’s how:
- Review your priority gaps (from the scoring sheet)
- For each high-priority component, identify 2-3 specific initiatives
- Estimate effort and impact for each initiative
- Sequence initiatives based on dependencies (fix Foundation first)
- Assign owners and timelines for each initiative
- Build a business case using the ROI frameworks on The Bottom Line: ROI Framework
The output should be a 12 to 18-month roadmap with clear milestones, owners, and success metrics.